


PowerPoint users may be disappointed to know that the SmartArt section does not have a dedicated fishbone diagram. You cannot edit an existing template to create a fishbone diagram in PowerPoint.
Fishbone diagram, Ishikawa, or cause-and-effect diagram, are the names for the same visual element. This diagram is used by professionals from many industries to identify, organize, and analyze the root causes of problems.
In this article, we will learn how to create a fishbone diagram in PowerPoint. You will be able to strengthen your slides for business analysis, project management, and quality management presentations.
What is a Fishbone Diagram in PowerPoint?
As the name suggests, a fishbone diagram looks like the skeleton of a fish, visually representing a problem and its potential causes.
Before learning how to create a fishbone diagram in PowerPoint, you need to understand the basic structure of the fishbone diagram for PowerPoint presentations:
- Head → The problem or effect
- Spine → The main line that connects causes to the problem
- Bones → Categories of causes
- Sub-bones → Specific contributing factors
Use of such creative diagrams adds value and details to your slides. Depending on the presentation, users can modify the categories and other aspects of the diagram.
Creating a Fishbone Diagram in PowerPoint
There are different ways to add a fishbone diagram to your PowerPoint presentation, but we will start with the manual method first. In this method, we will create a fishbone diagram from scratch. Follow these steps and make changes to the contents as needed.
Step 1: Draw the Main Shape
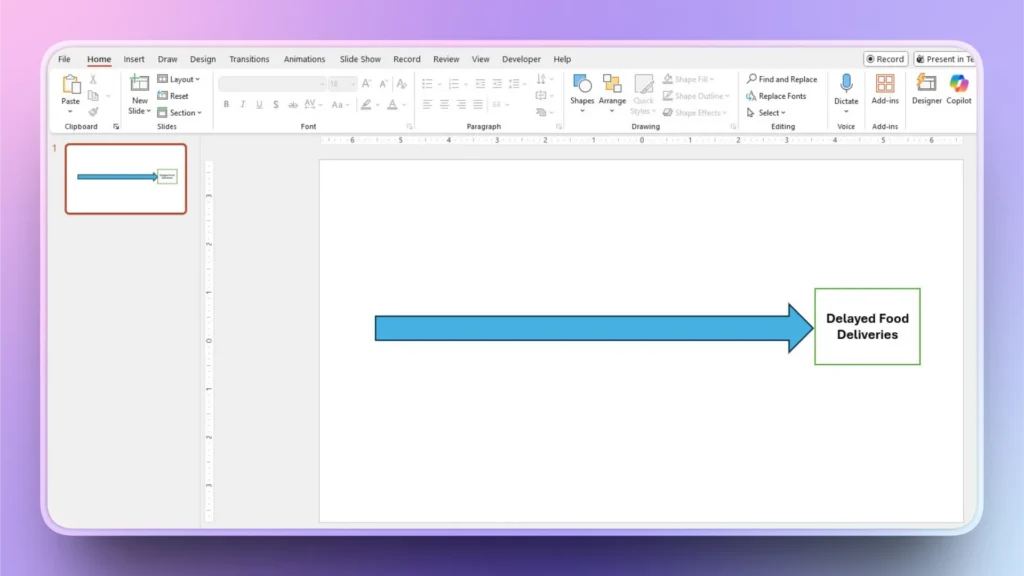
Open PowerPoint and start a blank presentation. In the blank slide, go to Insert >> Shapes >> Arrow and draw a horizontal line on the slide. This arrow represents the main problem.
Draw a rectangle at the right end of the spine and input the problem statement in the head/ rectangle.
Step 2: Add Ribs to the Spine
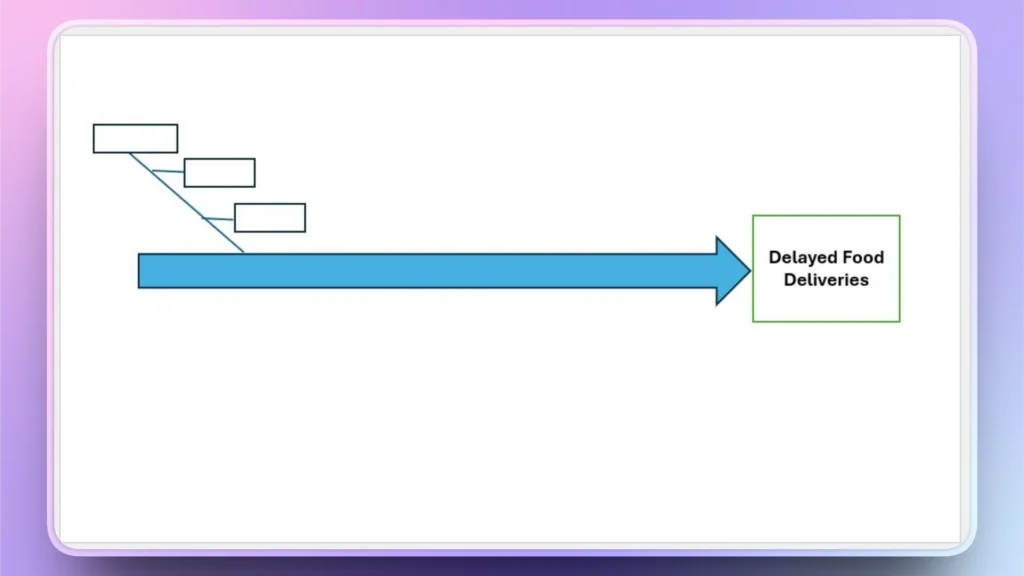
Draw diagonal lines as ribs, and these lines are the cause lines. We will draw one diagonal line at first and then add sub-reasons to the line as shown in the image.
Go to Insert >> Draw a diagonal line>> Add rectangles and then connect rectangles with the diagonal line with horizontal lines. You will get a shape like this.
Step 3: Add Ribs on the Top of the Spine
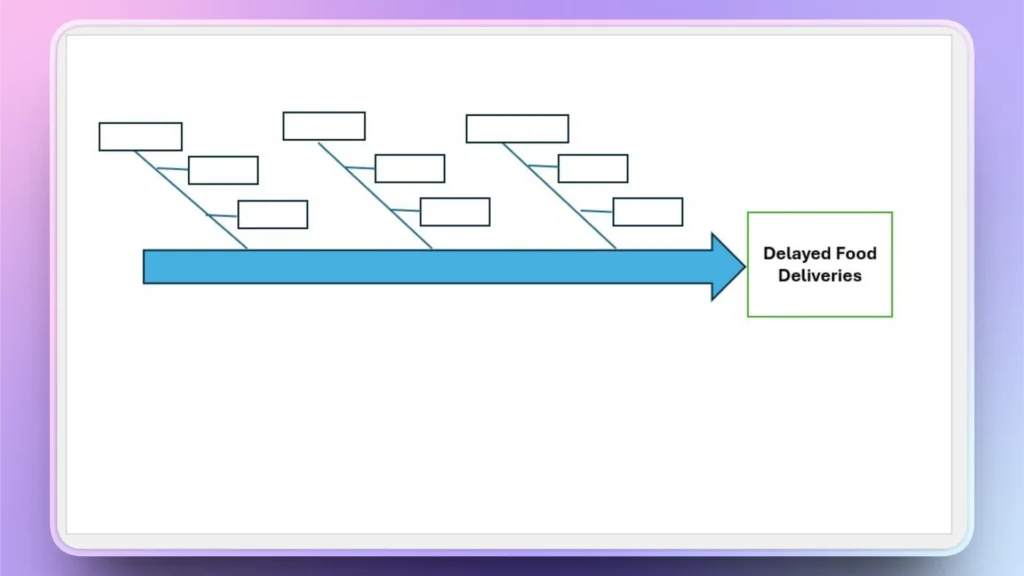
Copy the first diagonal line and text boxes as shown in step 2 and paste the same structure to create copies according to your project needs. You will get further structure like this image.
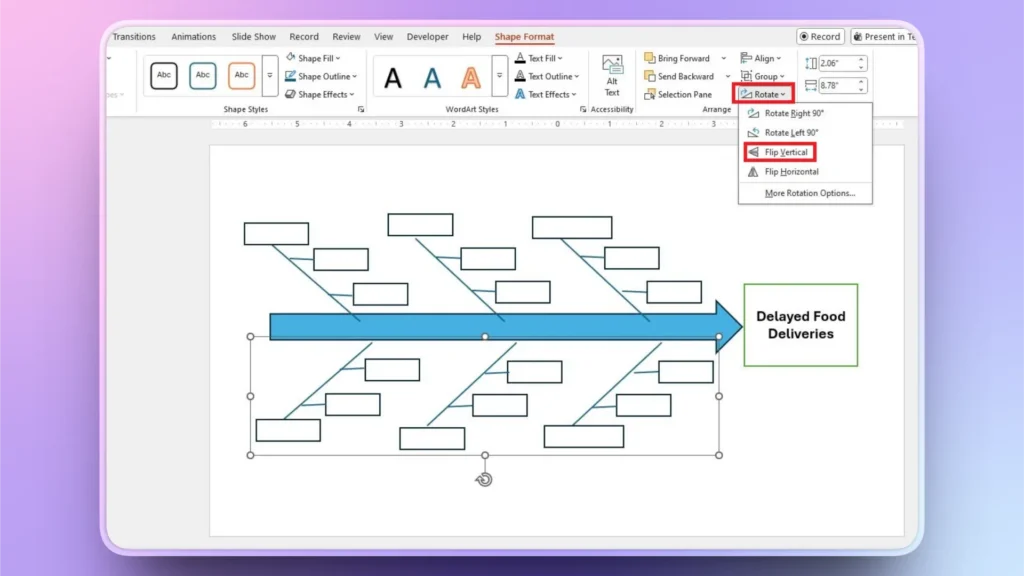
Step 4: Group all Ribs and Flip the Grouped Items
Select diagonal lines, text boxes, and main causes, and go to Shape Format >> Group and then group all selected items. Make sure your diagonal lines are also selected for grouping.
Now, copy the group and paste it. You will get a structure that does not seem right.
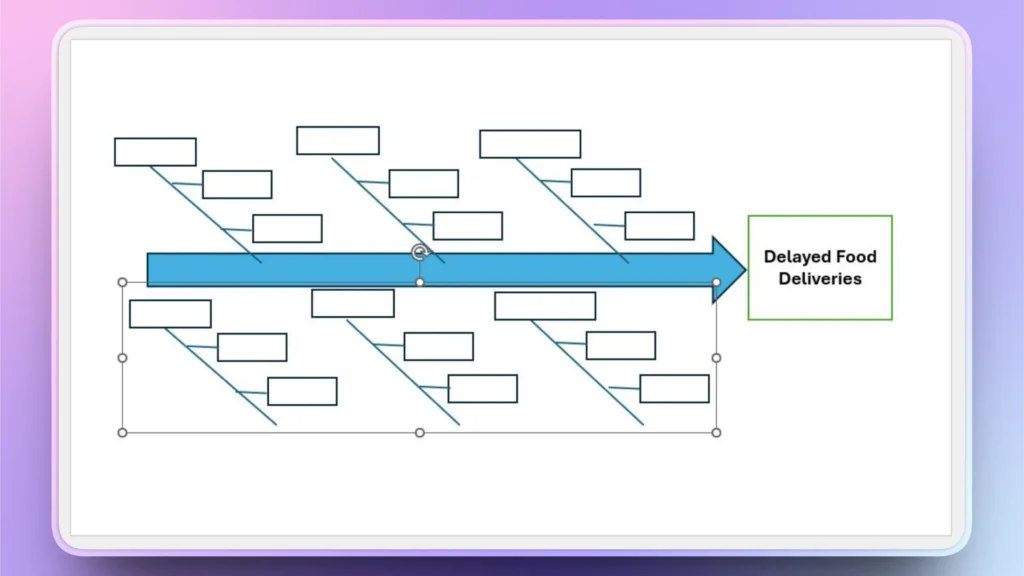
Select the pasted group and then go to Shape Format >> Rotate >> Flip Vertical, and now the structure seems complete and right as shown in the image below.
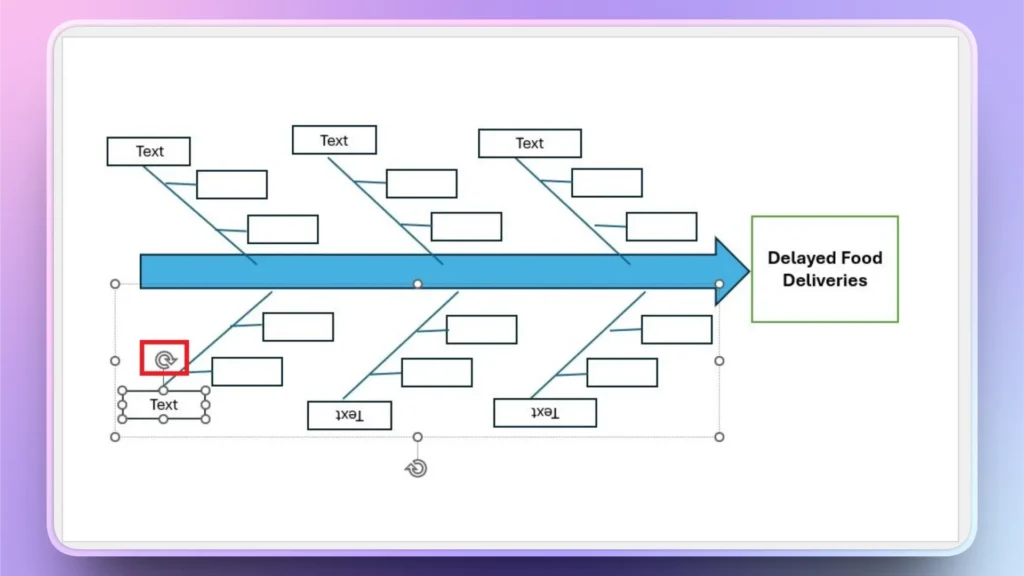
Step 5: Add Text and Rotate the Lower Rib’s Text
Enter text in the boxes according to your project’s needs. But there is a problem. The text in the lower rib is inverted.
Once you have added the text, select the text and simply use the controls alongside the text box to rotate the text by 180 degrees for readability.
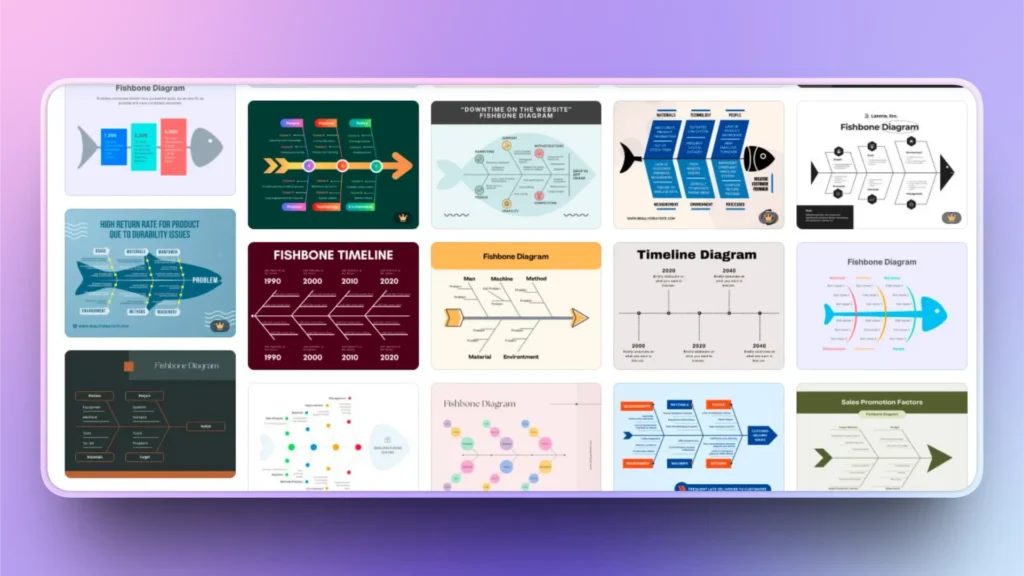
Alternate Method: Use Fishbone Diagram Templates
Professionals prefer making unique and novel designs and diagrams to maintain the brand identity. If you are not a tech-savvy person and want an easier way to create a fishbone diagram in PowerPoint, you can visit online stores for readily available fishbone diagram templates.
Once you have found the right diagram template, download it and open it to edit the template with custom content. Editing a template is easier than creating a diagram from scratch.
Note: There are some challenges and limitations with the fishbone templates that are available for free. These diagrams either come with watermarks or offer limited customization options. Premium templates cost money but offer a better experience and flexibility.
How to Use AI for Data Visualization in PowerPoint?
Adding and editing a presentation for better data visualization is hard. Experienced people also take hours to create visually appealing and detailed timelines and charts for PowerPoint presentations.
Would you like to know more about an AI tool that can add advanced data visualization items to slides with simple clicks?
Try Twistly for PowerPoint, a custom ChatGPT for presentations, where you can use readily available slide layouts and then customize them with AI prompts.
Create PowerPoint
Slides with AI
Build AI-powered presentations from
any prompt, doc, or video


How to use Twistly for Data Visualization?
The process of using Twistly is easy. Once you have downloaded and installed the Twistly add-in for PowerPoint, simply click the ChatGPT for PowerPoint icon, and a dedicated window will appear on the right side of the screen.
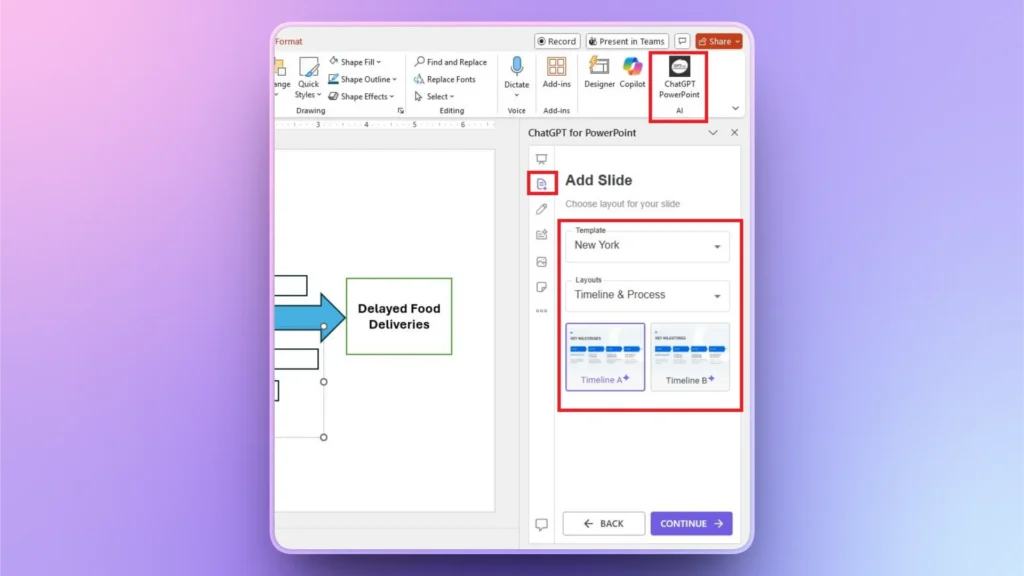
Step 1: Add a Custom Slide
Click the ” Add Slide button from the dashboard of Twistly and select a template and a layout type. You can choose any slide layout that you want to add to the presentation.
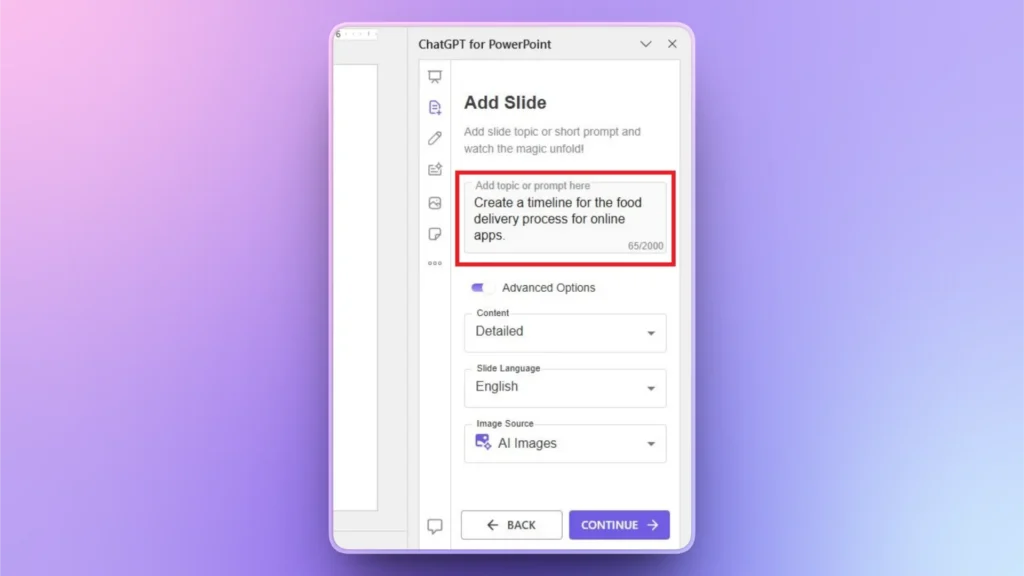
Step 2: Explain your Timeline
Explain what to cover in the timeline or what the timeline is about. You can use plain English to explain your idea and then also make further changes if needed.
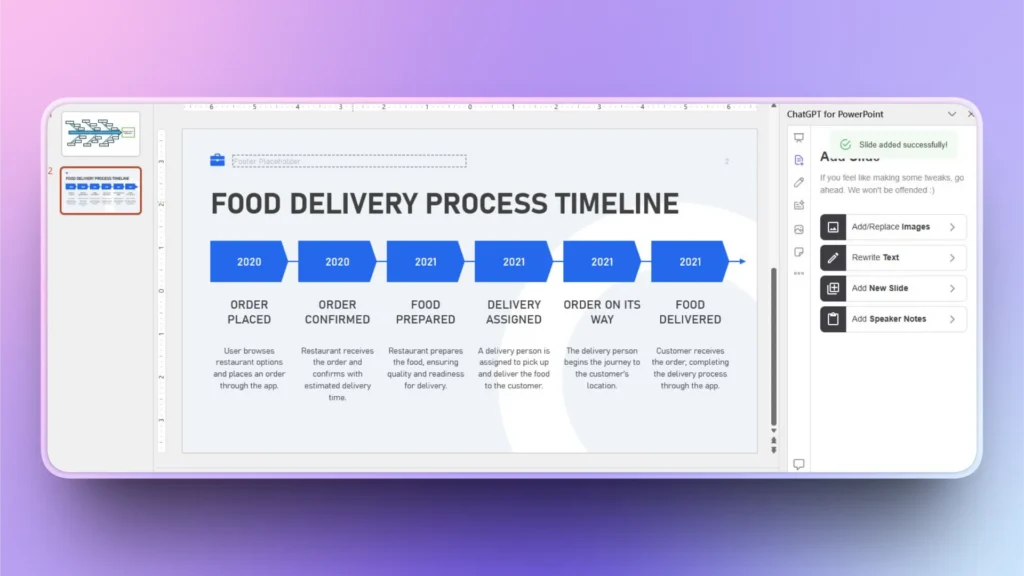
Step 3: Your New Slide is Ready
Within just a few seconds, Twistly will generate a fully editable and detailed timeline in a new slide. You can use the AI features of Twistly or the native PowerPoint tools for further edits.
Final Words
You can create a fishbone diagram in PowerPoint by using simple lines and rectangles to explain the main problem and its causes. The process is long but easy to follow. For other data visualization elements, use Twistly and add slides with a few clicks, thanks to AI.


Start Making AI Presentations in Seconds
Instant Access
Begin exploring Twistly’s full suite of features immediately
No Commitments
No credit card required, and you can cancel anytime
Dedicated Support
Our team is here to assist you every step of the way during your trial.