


So, you’ve meticulously crafted your PowerPoint presentation, complete with high-resolution images that make each slide really pop. But when it’s time to share or upload, you run into a problem. Your PowerPoint file size is larger than expected, and it’s causing problems when you try to email or upload it. This is where knowing how to compress images in PowerPoint can be useful.
Why Should You Compress Images in Your Presentation?
But why should you compress those images in the first place? Well, it’s all about efficiency and accessibility. Here is why it’s important:
- Faster Load Times: Large images can slow down your presentation’s performance, especially if you’re using an older computer.
- Easier Sharing: Smaller file sizes are easier and quicker to email and upload, making collaboration seamless.
- Storage Management: Reducing file sizes helps you manage your storage, particularly when dealing with multiple presentations.
- Professionalism: A streamlined presentation is just professional, as it reflects your attention to detail.
[READ MORE: How to Create a Professional PowerPoint Presentation]
Step-By-Step Guide for Reducing Your PowerPoint Image Sizes
Thankfully, PowerPoint offers built-in tools for reducing your image sizes so that you don’t have to compromise on quality. Let us show you how it’s done. Follow these steps and you’ll have compressed images that still look great.
- Select an Image: Click on the image you want to compress.
- Access the Picture Format Tab: With the image selected, click the Picture Format tab in the toolbar.
- Click on ‘Compress Pictures’: You’ll see this option in the Adjust group.
- Choose the Preferred Compression Options:
- Apply only to this picture: Check this box if you want to compress only the selected image. Uncheck it to compress all images in the presentation.
- Delete cropped areas of pictures: Selecting this will remove any cropped-out areas, further reducing file size.
- Resolution: Choose the appropriate resolution based on how the presentation will be used:
- Email (96 ppi): For presentations shared via email.
- Web (150 ppi): For online presentations.
- Print (220 ppi): For printed versions.
- Click ‘OK’: After selecting your options, click ‘OK’ to apply the compression.
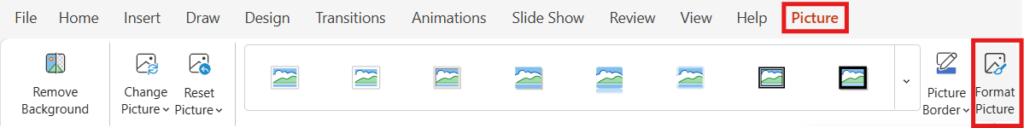
Note that these steps are for the PowerPoint desktop app and that image compression is not available in PowerPoint online, though it does offer some formatting options accessed through the Picture tab (see image below).
Additional Tips to Reduce PowerPoint Image Size
It might be helpful to take steps to reduce your image size before placing it into the slide in the first place. Here are some helpful tips that can keep you from having to use the image compression feature in PowerPoint and being surprised by a large file size after your slides have already been created.
- Insert Images Properly: Don’t copy and paste them. Use the Insert function to add your images. This offers better control over image size and quality.
- Use Appropriate Image Formats: JPEGs are generally smaller in size compared to PNGs, and in most cases, the quality will be good enough for your presentation purposes.
- Avoid High-Resolution Images: You can use high-resolution images if it’s absolutely necessary, but just keep it to a limit. Using too many is going to increase your file size.
- Utilize Other Compression Tools: Before inserting images, consider using online tools like TinyPNG or Compressor.io to reduce image sizes.
The most important thing here is to be mindful of the image sizes you place in your PowerPoint. As we demonstrated, there are ways to do this ahead of time, but if you do find yourself with slides containing large images, you’ll be glad to know how to compress them from within PowerPoint itself.
Create PowerPoint
Slides with AI
Build AI-powered presentations from
any prompt, doc, or video


Start Making AI Presentations in Seconds
Instant Access
Begin exploring Twistly’s full suite of features immediately
No Commitments
No credit card required, and you can cancel anytime
Dedicated Support
Our team is here to assist you every step of the way during your trial.