


¿Se puede crear una presentación tipo dashboard con IA?

Sí, puedes crear una presentación de dashboard con IA usando herramientas de visualización de datos como gráficos, diagramas, cronogramas y otros elementos. Crear estos elementos visuales a mano puede llevar horas por cada diapositiva. Directivos y responsables dependen en gran medida de las presentaciones de dashboard para analizar y entender los datos, el rendimiento de la empresa y otros KPI.
Las presentaciones de dashboard son como un centro de mando para las empresas: impulsan decisiones con datos accionables. La herramienta de IA adecuada puede convertir datos en bruto en dashboards con sentido.
Twistly es un complemento de IA para PowerPoint que funciona dentro del programa y permite crear gráficos, diagramas y otros elementos visuales de datos con un solo clic. En este artículo responderemos a tu pregunta en detalle y veremos cómo Twistly puede crear una presentación de dashboard con IA.
¿Qué es una presentación de dashboard?
Una presentación de dashboard es una presentación de informes visual que muestra análisis de negocio, métricas y otros datos operativos importantes. Cada diapositiva hace que los datos sean más fáciles de entender y asimilar. Puedes crear una presentación de dashboard con IA para distintos fines, entre ellos:
- Informes para la dirección
- Revisiones trimestrales de negocio (QBR)
- Análisis del rendimiento de ventas
- Analítica de marketing
- Información financiera
- Seguimiento operativo
- Seguimiento del éxito de clientes
A diferencia de las presentaciones normales, las presentaciones de informes se centran sobre todo en representar los datos de forma interactiva. El objetivo es ayudar a las partes interesadas a entender grandes volúmenes de información rápidamente y a tomar decisiones de negocio fundamentadas.
¿Puede la IA crear una presentación de dashboard?
Con una herramienta de presentaciones con IA completa, es posible crear una presentación de dashboard. Si usas cualquier diseñador de diapositivas con IA, puede que necesites otras herramientas para crear una presentación de dashboard completa con IA.
Crear PowerPoint
Diapositivas con IA
Cree presentaciones basadas en IA a partir de
cualquier mensaje, documento o vídeo


Usar la IA para crear presentaciones de dashboard ofrece varias ventajas, ya que obtienes un resultado más personalizado con menos esfuerzo. Esta tabla te ayudará a entender las principales diferencias entre crear una presentación de dashboard a mano y con IA.
| Flujo de trabajo tradicional | Flujo de trabajo con IA |
| Creación manual de diapositivas | Generación automática de diapositivas |
| Formato que consume mucho tiempo | Diseños profesionales al instante |
| Diseño incoherente | Marca y estructura coherentes |
| Organización manual de los KPI | Estructuración inteligente del contenido |
| Redacción y diseño por separado | Flujo de trabajo unificado con IA |
| Actualizaciones lentas de los informes | Revisiones y actualizaciones más rápidas |
Cómo crear una presentación de dashboard con Twistly
Twistly está desarrollado para acelerar la creación de presentaciones para profesionales, especialistas en marketing, estudiantes, profesores, empleados y otros usuarios de PowerPoint.
Si quieres una presentación de dashboard con IA lista para el entorno empresarial, sigue estos sencillos pasos y crea una presentación de dashboard interactiva.
Paso 1: Abrir PowerPoint y Twistly
Inicia una nueva presentación de PowerPoint y abre Twistly. En el panel de Twistly, selecciona Create New Presentation y elige el tipo de entrada: tema, prompt de IA, texto o subida de documento.
Paso 2: Define el objetivo del dashboard
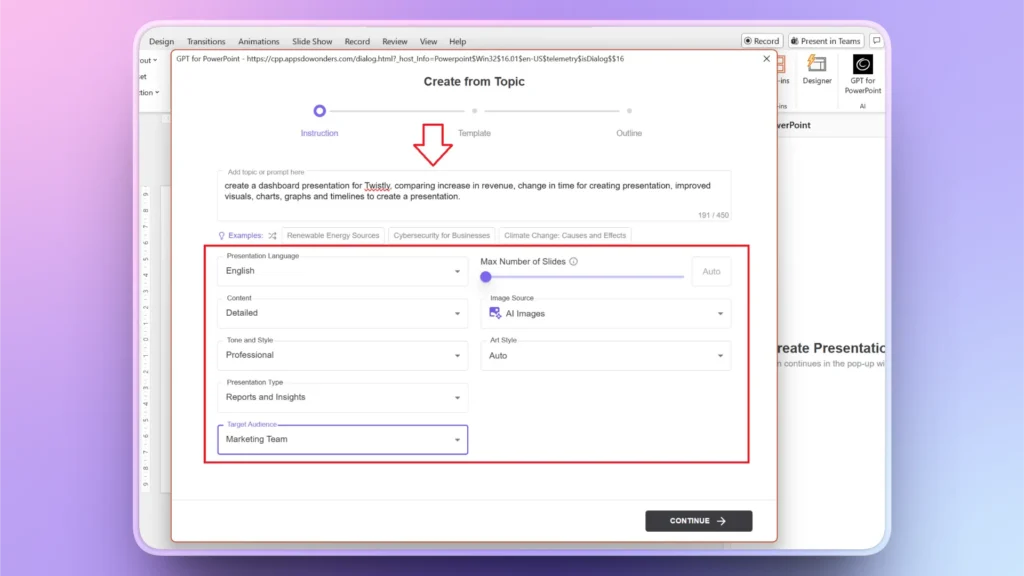
Ya tienes el tema; el siguiente paso es definir el objetivo de tu presentación. Es un factor imprescindible, porque te permite personalizar la presentación según tus necesidades.
Twistly permite configurar el tipo de público, la extensión del contenido, el tono y el tipo de presentación según los objetivos de tu presentación de dashboard.
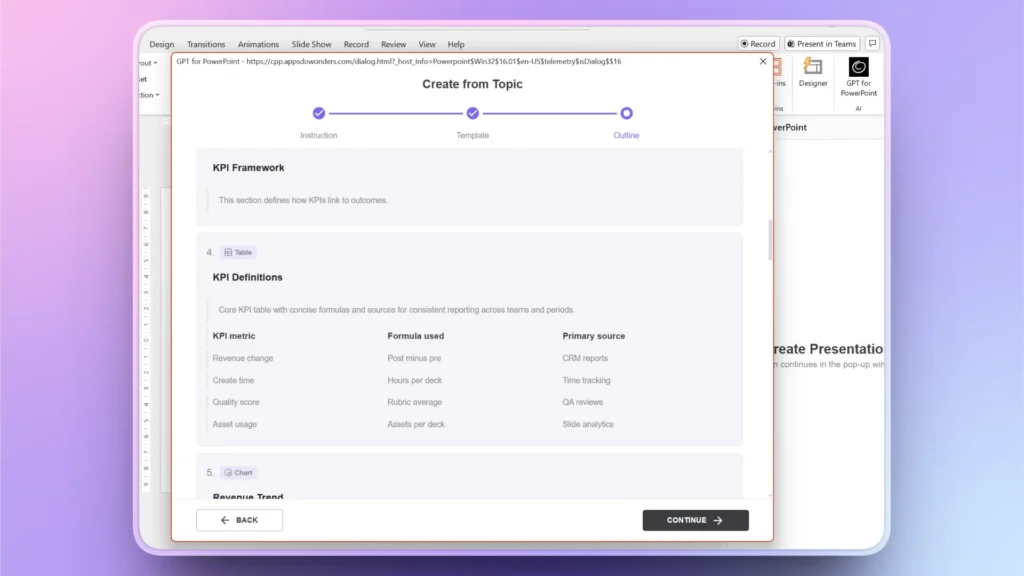
Paso 3: Elige una plantilla y revisa el esquema
Elige cualquier plantilla de IA de la biblioteca y revisa el esquema que Twistly genera para el tema de tu presentación. Puedes añadir diapositivas nuevas en este paso o más adelante. Si todo está bien por ahora, haz clic en Continue y pasa al siguiente paso.
Paso 4: Añade cifras y KPI
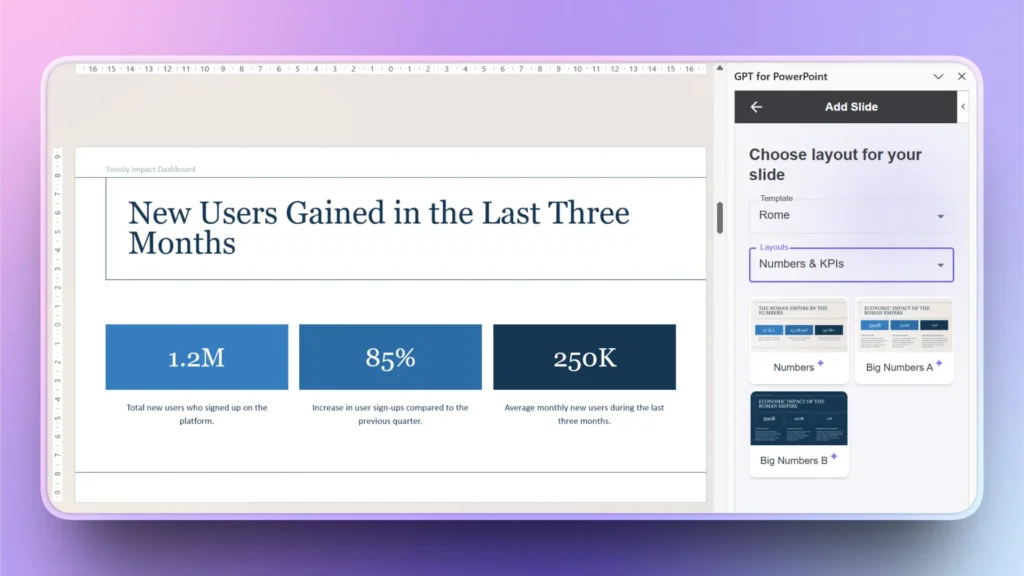
Añadir KPI
¿Faltan diapositivas concretas o KPI de negocio en tu presentación de dashboard generada con IA? Twistly ofrece opciones sencillas para añadir más diapositivas a la presentación.
Edit Slides >> Add Slide >> elige Numbers and KPIs en Layouts >> Pick a Layout
Añadir gráficos y diagramas
¿Necesitas gráficos y diagramas para tu presentación que cubran unos datos concretos? Selecciona Data and Charts en Layouts, explica qué debe mostrar el gráfico y Twistly creará una diapositiva con el gráfico para tu presentación de dashboard.
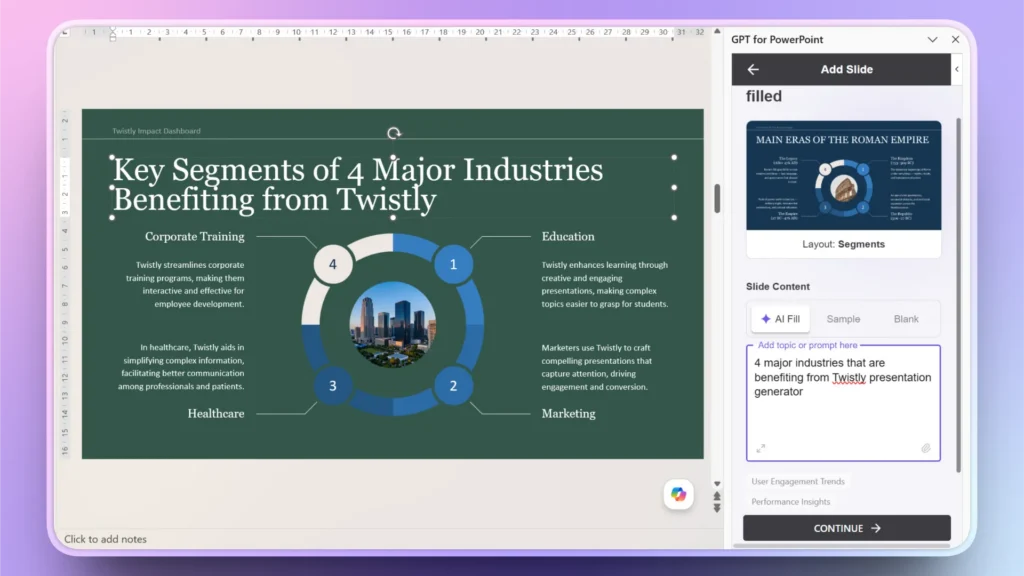
Añadir cronogramas
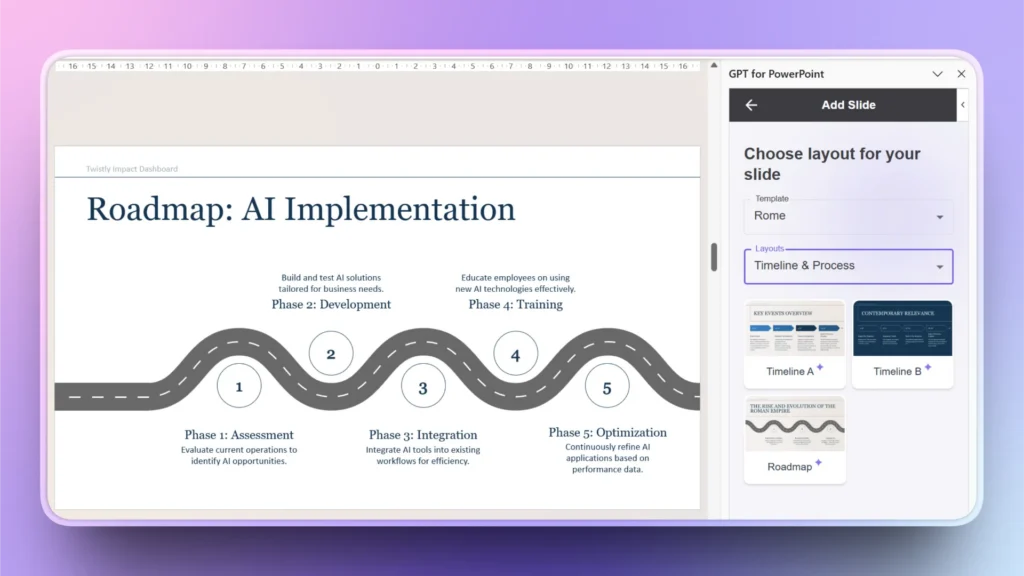
¿Cómo crear una hoja de ruta para usar tu herramienta? ¿Qué pasos deben seguir los usuarios para aplicar la IA en las operaciones de su negocio? Twistly puede convertir tu prompt de IA en una hoja de ruta interactiva en pocos clics.
Paso 5: Revisa y perfecciona los datos
Todo este proceso no lleva más de unos minutos. La precisión del resultado depende de los datos y la información que aportes.
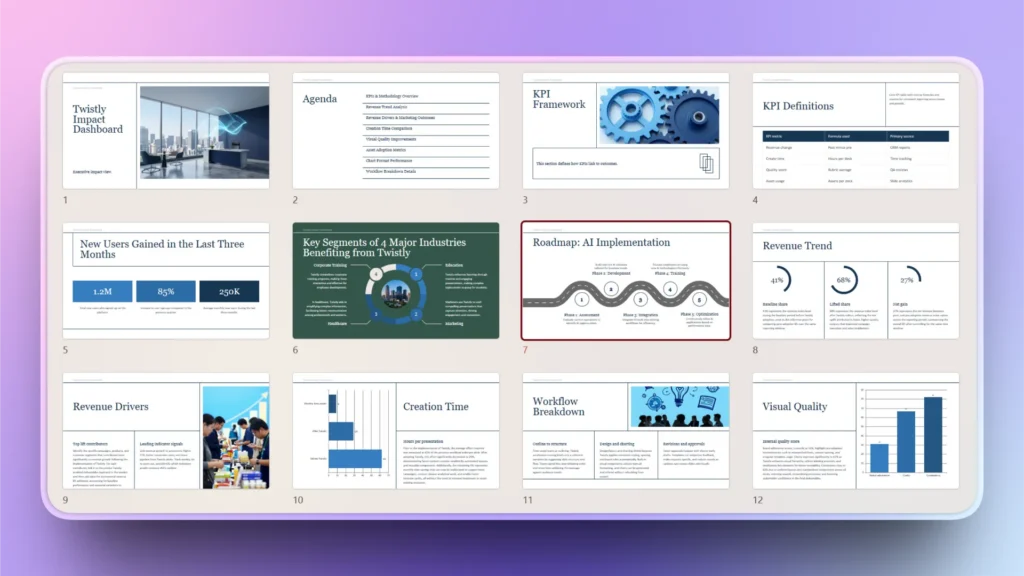
Cuando tu presentación de dashboard esté lista, revisa todas las diapositivas, añade más si hace falta y mejora el contenido o los elementos visuales con IA. Twistly tiene varias funciones y herramientas de IA que te ayudan a optimizar tus presentaciones para conseguir mejores imágenes, diseño, contenido y visualización de datos.
¿Quién puede usar Twistly para crear presentaciones?
Twistly funciona con los modelos de IA más recientes y permite crear presentaciones de todo tipo de temas, nichos y formatos. Cualquier usuario de PowerPoint puede hacer presentaciones con Twistly.
Es básicamente un ChatGPT personalizado para PowerPoint, con funciones de IA fáciles y rápidas para crear presentaciones de PowerPoint. Entre los usuarios habituales de Twistly están:
- Especialistas en marketing y gestores de campañas
- Estudiantes y profesores
- Directivos y CEO
- Equipos de RR. HH. y empleados de oficina
- Fundadores de startups y emprendedores
- Usuarios habituales de PowerPoint
Puedes crear una presentación de dashboard con IA para supervisar y analizar las ventas, los ingresos, los beneficios, el crecimiento y otros factores que requieren cifras, datos y análisis.
Tanto si creas una presentación de dashboard con IA como a mano, mantén los datos de tus diapositivas bien enfocados. Puede que algunas diapositivas necesiten bloques de texto y otros detalles, pero el foco debe estar en presentar las cifras con gráficos, diagramas, barras y otros elementos.
Palabras finales
Sí, Twistly puede crear una presentación de dashboard con IA y mostrar tus datos de forma eficaz en minutos. Solo tarda unos minutos en convertir tus datos en bruto en información útil y en una presentación de dashboard atractiva.
¿Eres nuevo en Twistly y quieres probar gratis este creador de presentaciones con IA? Descarga ahora la versión de prueba gratuita y descubre el poder de la IA para presentaciones de dashboard y otras presentaciones de PowerPoint.
La versión de prueba es totalmente gratuita y no requiere tarjeta de crédito ni suscripción. Para desbloquear todas las funciones y capacidades de IA adicionales, mejora tu suscripción a Twistly en cualquier momento a un precio muy competitivo. Haz clic en el botón de abajo para descargar tu versión de prueba gratuita.
Crear diapositivas de PowerPoint con IA
Crea presentaciones basadas en IA a partir de cualquier mensaje, documento o vídeo











Empieza a hacer presentaciones con IA en segundos
Acceso instantáneo
Empieza a explorar inmediatamente todas las funciones de Twistly
Sin compromisos
No necesitas tarjeta de crédito y puedes cancelar cuando quieras
Asistencia dedicada
Nuestro equipo te ayudará en cada paso durante tu periodo de prueba